

The TSX Venture Exchange Index (TSX.V), a hub for junior mining and exploration companies, has historically been a bellwether for sentiment in the resource sector, particularly for gold-focused firms. For decades, the TSX.V moved in tandem with gold prices, reflecting the speculative fervor of investors chasing the next big discovery. However, over the past five years (2020–2025), this once-tight correlation has unraveled, leaving junior resource stocks trading at valuations that starkly undervalue the soaring price of gold, which hit record highs above $3,100 per ounce in 2025. This article examines the TSX.V’s historical peaks in 2007/2008 and 2011, the factors driving its decoupling from gold, the extent of the junior mining sector’s undervaluation, and the potential upside required for the TSX.V to realign with gold prices.
The TSX.V’s Historical Context: 2007/2008 and 2011 Peaks
The TSX.V, based in Toronto, Canada, is the world’s leading exchange for junior mining companies, with approximately 50% of its issuers engaged in exploration or mining, many focused on gold. Historically, the index has been highly sensitive to commodity cycles, particularly gold, due to its role as a safe-haven asset and inflation hedge. The TSX.V’s performance in the mid-2000s and early 2010s illustrates this dynamic.
In 2007 and early 2008, during the pre-financial crisis commodity boom, the TSX.V soared to remarkable heights, reaching an all-time high of approximately 3,370 points in May 2007, when gold was trading around $650–$700 per ounce. This period was marked by a global resource frenzy, with surging demand for metals driven by industrialization in China and other emerging markets. Junior miners, speculative by nature, attracted significant capital, pushing valuations to euphoric levels. The TSX.V’s 2007 peak implied a ratio of roughly 5 index points per dollar of gold price, reflecting the market’s exuberance.
The 2008 financial crisis triggered a sharp correction, with the TSX.V plummeting to a low of around 690 points by November 2008, a nearly 80% decline, as gold briefly dipped below $700 per ounce. However, the index staged a robust recovery, climbing to 2,400 points by March 2011, when gold reached approximately $1,900 per ounce. This 2011 peak, while lower than the 2007 high, was still significant, reflecting post-crisis stimulus, inflationary fears, and renewed investor interest in gold. The 2011 ratio of TSX.V points to gold price was approximately 1.26 index points per dollar of gold, a more tempered multiple than the 2007 mania but still indicative of a strong correlation.
The Decoupling: 2020–2025

Since 2020, the TSX.V’s performance has diverged dramatically from gold prices, breaking the historical correlation. Gold has rallied impressively, climbing from around $1,800 per ounce in early 2020 to over $3,100 per ounce in 2025—a 72% increase. This surge has been driven by geopolitical tensions, trade disputes, central bank gold purchases, and persistent inflation. In contrast, the TSX.V has languished, failing to capture the upside of gold’s bull market.
In February 2022, the TSX.V reached a recent high of 1,113 points, but by December 2022, it had collapsed to 551 points, a 50.5% drop. As of May 2025, the index trades between 600 and 700 points, a fraction of its 2007 peak of 3,370 and its 2011 peak of 2,400. This stagnation is particularly striking given gold’s record highs, highlighting a profound disconnect.
To quantify this divergence, let’s revisit the historical TSX.V-to-gold ratios:
- 2007: At 3,370 points with gold at $700 per ounce, the ratio was ~4.81 points per dollar.
- 2011: At 2,400 points with gold at $1,900 per ounce, the ratio was ~1.26 points per dollar.
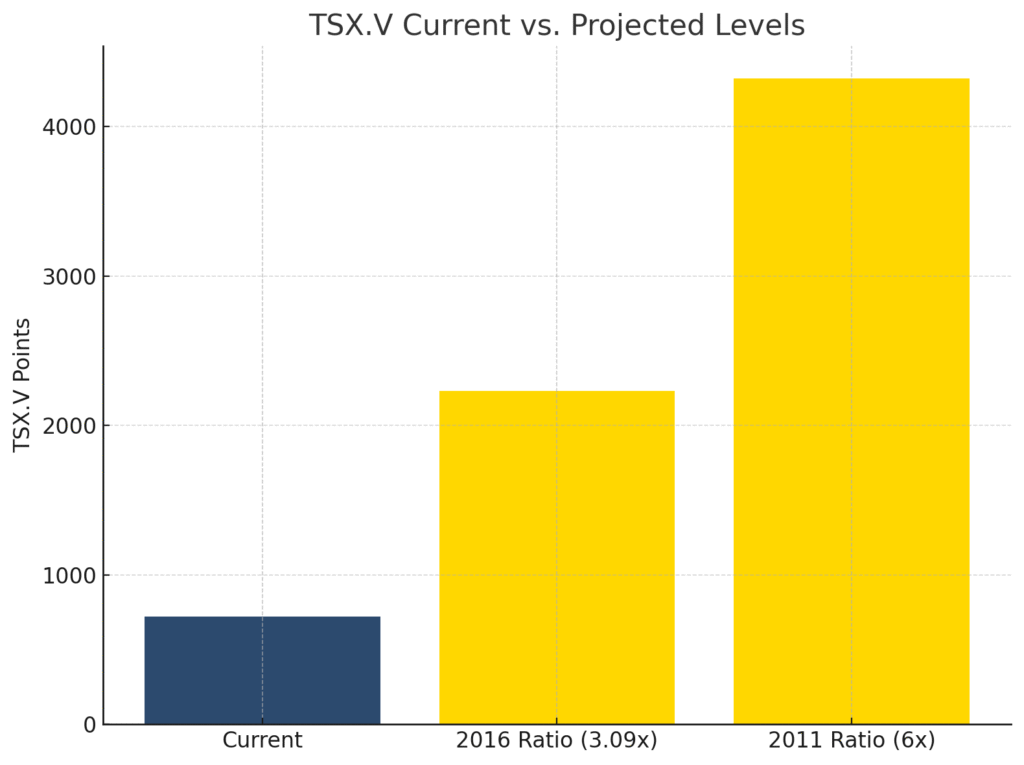
- 2025: With gold at $3,100 per ounce and the TSX.V at ~700 points, the current ratio is a mere 0.23 points per dollar.
Applying the 2011 ratio of 1.26 to today’s gold price of $3,100 suggests the TSX.V should be trading at approximately 3,906 points—over 5.5 times its current level. Using the more exuberant 2007 ratio of 4.81 yields a hypothetical TSX.V level of 14,911 points, an implausible 21x increase, underscoring the speculative fever of that era. Even a conservative ratio from a less frothy period, such as 2016 (when the TSX.V hit 848 points with gold at $1,300 per ounce, a ratio of 0.65), implies a TSX.V level of 2,015 points—a 2.88x increase from 700 points.
Factors Driving the Decoupling
Several structural and market-driven factors have contributed to the TSX.V’s underperformance relative to gold over the past five years:
- Shift in Investor Preferences: The rise of gold-focused exchange-traded funds (ETFs), such as the VanEck Vectors Junior Gold Miners ETF (GDXJ), and senior producers like Barrick Gold has siphoned capital from speculative juniors. Investors seeking gold exposure increasingly favor these less volatile options, reducing flows to TSX.V-listed firms.
- Post-2011 Bear Market Scars: The commodity bear market of 2011–2016, when the TSX.V fell to a low of 466 points, left lasting damage. Retail investors, burned by losses, have been slow to return, even as gold prices recovered. The “nightmarish plunge” of that era continues to cast a shadow.
- Financing Challenges: Junior miners rely on equity financings to fund exploration, but dilutive share issuances during bearish periods have eroded shareholder value. In a risk-averse market, securing capital has been difficult, depressing valuations.
- Competition from Other Sectors: The past five years have seen explosive growth in technology, clean energy, and cryptocurrencies, diverting speculative capital from junior miners. Investors chasing AI or renewable energy have overlooked the resource sector, despite gold’s strong fundamentals.
- Delayed Market Response: Junior gold stocks often lag behind gold price increases. In 2024, while gold gained nearly 30% year-to-date, TSX.V-listed juniors saw delayed appreciation, exacerbating the valuation gap.
The Extreme Undervaluation of Junior Resource Stocks

The TSX.V’s decoupling from gold has left junior resource stocks trading at historically low valuations, offering compelling evidence of their undervaluation:
- Market Cap to Resource Ratios: In 2023, a TSX.V-listed junior with a 43-101 compliant resource of 2 million ounces of gold could be acquired for as little as CAD $4 million, implying a valuation of $2 per ounce in the ground. At $3,100 per ounce in 2025, this is a fraction of historical norms ($20–$50 per ounce for inferred resources).
- Top Performers Undervalued: Even top TSX.V gold stocks in 2025, such as Eros Resources, Goldgroup Mining, and Blue Star Gold, trade at market caps below CAD $50 million, despite significant resources. For example, Blue Star Gold’s Ulu project hosts 572,000 ounces of measured and indicated gold at 7.02 g/t, yet its valuation remains modest.
- Historical Comparisons: The TSX.V’s current level of ~700 points is closer to its 2016 low (466 points, gold at $1,300 per ounce) than its 2007 (3,370 points) or 2011 (2,400 points) peaks. This suggests juniors are priced as if gold were still at 2016 levels, ignoring its 140% price increase.
- Sector Neglect: The TSX.V’s gold sub-index has underperformed the S&P/TSX Composite, which includes senior miners. Low retail and institutional ownership, with “very, very, very few” investors holding junior precious metal stocks, amplifies the undervaluation.
How Much Would the TSX.V Need to Multiply?
To realign with gold prices, the TSX.V would require a significant revaluation. Using the 2011 ratio of 1.26 points per dollar of gold price, a gold price of $3,100 per ounce implies a TSX.V level of 3,906 points. From its current ~700 points, this represents a 5.58x multiplier. A more conservative 2016 ratio of 0.65 suggests a TSX.V level of 2,015 points, a 2.88x increase. Even this conservative scenario highlights the sector’s undervaluation, offering nearly triple the current value.
The 2007 ratio of 4.81, while reflective of a speculative bubble, yields a TSX.V level of 14,911 points—a 21x increase. While such a multiplier is unlikely, it underscores the potential for outsized gains if investor sentiment shifts dramatically.
Why Junior Resource Stocks Are a Compelling Opportunity
The TSX.V’s undervaluation presents a rare opportunity for speculative investors. Several factors suggest a potential rebound:
- Gold’s Bull Market: Gold’s rally, driven by geopolitical risks, trade tariffs, and central bank demand, shows no signs of slowing. As gold sets new highs, the lag in junior stock prices is likely to narrow.
- M&A Activity: Majors like Newcrest and Agnico Eagle have acquired TSX.V-listed juniors, often at premiums, highlighting the value in these assets. This trend could accelerate as seniors seek to replenish reserves.
- Technical Signals: In 2023, the TSX.V broke out of a falling wedge pattern with high volume, signaling renewed interest. Similar setups could emerge as sentiment improves.
- Low Ownership Base: The TSX.V’s micro-cap nature and low ownership create potential for outsized gains from modest capital inflows.
Risks to Consider
The junior mining sector is not without risks. Volatility, reliance on financing, and sensitivity to commodity prices make it unsuitable for risk-averse investors. Political and regulatory risks in mining jurisdictions can also impact valuations. A prolonged lag in market recognition or competition from other asset classes could delay the TSX.V’s recovery.
Conclusion: A Historic Opportunity in Junior Miners
The TSX.V’s broken correlation with gold prices over the past five years has left junior resource stocks trading at valuations that defy the fundamentals of the metals they explore. From its 2007 peak of 3,370 points to its 2011 high of 2,400 points, the TSX.V has historically thrived during gold bull markets. Its current level of ~700 points, despite gold’s climb to $3,100 per ounce, suggests a sector ripe for revaluation. Historical ratios indicate the TSX.V could multiply by 2.88x to 5.58x to realign with gold, implying gains of 188% to 458%.
With gold’s bull market intact, increasing M&A activity, and the TSX.V’s micro-cap nature, junior resource stocks offer a compelling opportunity for speculative investors. While risks remain, the potential for outsized returns in this under-researched, under-owned, and undervalued sector is undeniable. The TSX.V’s juniors may soon reclaim their place as a high-reward corner of the market, capitalizing on a historic dislocation.
Disclosure Statement
This article contains forward-looking statements regarding the company featured. These statements are based on current expectations and assumptions and involve known and unknown risks, uncertainties, and other factors that may cause actual results to differ materially from those expressed or implied. Readers are cautioned not to place undue reliance on forward-looking statements.
Neither the author nor GEKKOvsWOLF has any business relationship with any company featured in this article. No compensation has been received for the creation, publication, or distribution of this content. This article reflects the personal opinions of the author and is provided for informational purposes only. It does not constitute financial, investment, or legal advice.
Readers are strongly encouraged to perform their own due diligence and consult with a licensed financial advisor before making any investment decisions. Investing in junior resource companies or crypto-related projects involves significant risks, including the potential loss of principal. For comprehensive and up-to-date information, refer to the company’s public filings on SEDAR+, OTC Markets, EDGAR, and other official disclosure sources.